BALTIMORE (Stockpickr) -- It finally happened. The Fed announced yesterday that it would only be spending $75 billion in stimulus each month, a move that the market reacted to with surprising enthusiasm. The S&P 500 ended the day up more than 1.66% after spending most of the session underwater.
Of course, the Fed's decision to taper wasn't exactly a surprise. The data supported easing off on the throttle a little. And anyway, Bernanke & Co. left plenty of "outs" to resume full-blown QE3 right as the Senate gets ready to vote on letting Janet Yellen take the big desk.
So maybe the market's reaction yesterday wasn't much of a surprise either.
But it is creating some big opportunities in some of Wall Street's biggest names. That's why we're taking a technical look at five post-taper trades to take this week.
If you're new to technical analysis, here's the executive summary.
Technicals are a study of the market itself. Since the market is ultimately the only mechanism that determines a stock's price, technical analysis is a valuable tool even in the roughest of trading conditions. Technical charts are used every day by proprietary trading floors, Wall Street's biggest financial firms, and individual investors to get an edge on the market. And research shows that skilled technical traders can bank gains as much as 90% of the time.
Every week, I take an in-depth look at big names that are telling important technical stories. Here's this week's look at five high-volume stocks to trade this week.
Nordstrom
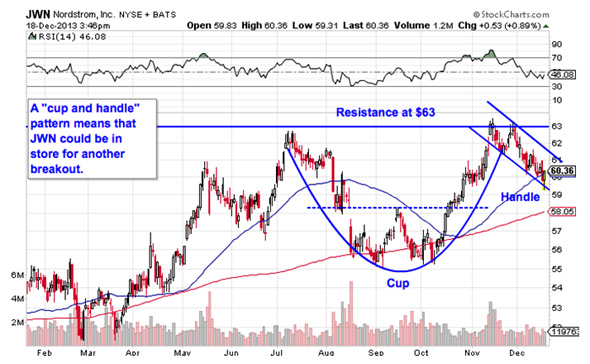
First up is department store retailer Nordstrom (JWN). By and large, Nordstrom has failed to live up to the broad market's impressive rally this year. While the S&P is up more than 25% since the calendar flipped over to January, Nordstrom has only managed to make half that. But if the price action holds, JWN could be in store for a big move higher.
Nordstrom is currently forming a cup-and-handle pattern, a classic bullish price setup that's formed by a cup-shaped rounding bottom and a short-duration channel down. So even though JWN has been trending lower for the last two months, the longer-term prognosis is higher ground. The buy signal comes on a move through the pattern's price ceiling at $63.
The 50-day moving average has been a pretty good proxy for support in the past, so this week's test of that level could be the start of the move back up to $63 resistance. After the breakout, it's also the level when I'd recommend keeping a protective stop.
UnitedHealth Group
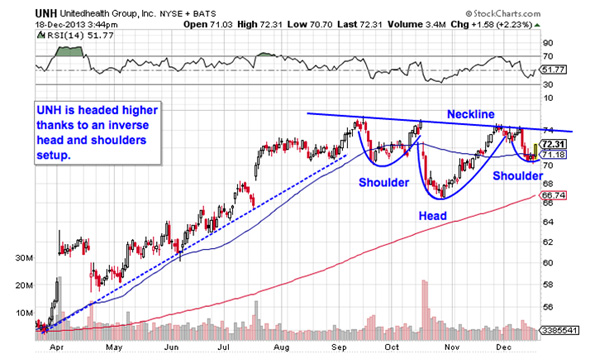
2013 has been a bit kinder to shareholders in UnitedHealth Group (UNH) -- or, more accurately, a lot kinder. UNH has rallied more than 33% since the start of the year's trading. But the setup in shares right now means that the rally isn't over yet.
UNH is currently forming an inverse head-and-shoulders pattern, a price setup that indicates exhaustion among sellers. The pattern is formed by two swing lows that bottom out around the same level (the shoulders), separated by a deeper low (the head). The buy signal comes on a move through the neckline, which is right at $74. A breakout above that level is our buy signal.
The inverse head-and-shoulders pattern (and its bearish counterpart) catches a lot of flack because it's so frequently spotted -- and, frankly, because it has a stupid name. But it works: A recent academic study conducted by the Federal Reserve Board of New York found that the results of 10,000 computer-simulated head-and-shoulders trades resulted in "profits [that] would have been both statistically and economically significant."
That's reason enough to keep an eye on the $74 level in UNH this month.
CIT Group
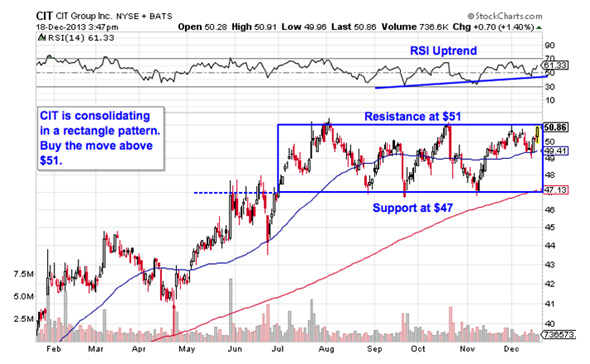
CIT Group (CIT) has been stuck in a trading range since the start of July, churning sideways at the same time that the S&P was broadly pushing higher. But with shares testing a key resistance level this week, CIT could be about to make a big directional move again.
The sideways churn in CIT is caused by a rectangle pattern, a consolidation setup that's formed by a horizontal resistance level above shares at $51 and horizontal support at $47. The rectangle gets its name because it basically "boxes in" shares of a stock -- the break outside of the box is the trade to take. So, if LKQ pushes above $51, then it's time to buy. Upside looks like the more likely outcome from here; since CIT's price action leading up to the rectangle in early 2013 was bullish, it's more likely to break out from the setup to the upside.
Kraft is committing a cardinal sin when it comes to relative strength. With a market that's correcting in December, relative strength is the single most important technical indicator to use with price -- and KRFT's RS line turned bullish months ago with no signs of strength.
This food stock is lagging the market big time, and not just because of a shape on a chart.
Whenever you're looking at any technical price pattern, it's critical to think in terms of buyers and sellers. Triangles and the other setups we've looked at are a good quick way to explain what's going on in a stock, but they're not the reason it's tradable. Instead, it all comes down to supply and demand for shares.
That support level at $52 is a price where there had been an excess of demand of shares; in other words, it's a place where buyers were more eager to step in and buy shares at a lower price than sellers were to sell. That's what makes a breakdown below $52 so significant -- the move would indicate that sellers are finally strong enough to absorb all of the excess demand above that price level. Wait for that trigger before you sell.
Illinois Tool Works
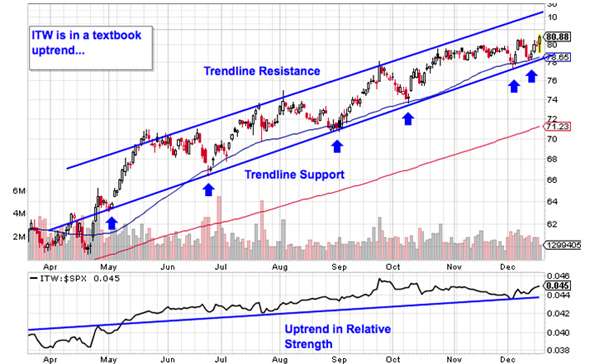
On the bull side, Illinois Tool Works (ITW) is bringing things back to basics. You don't have to be an expert technical analyst to figure out what's going on in this $36 billion manufacturing stock. Here's why.
ITW is currently trading higher in an uptrending channel, a setup formed by a pair of parallel trend lines. When it comes to price channels, up is good and down is bad; it's as simple as that. Shares have bounced higher on each of the last six tests of trend line support, and so, with the most recent bounce just a couple sessions ago, now is a pretty good time to be a buyer.
Buying off a support bounce makes sense for two big reasons: It's the spot where shares have the furthest to move up before they hit resistance, and it's the spot where the risk is the least (because shares have the least room to move lower before you know you're wrong). Remember, all trend lines do eventually break, but by actually waiting for the bounce to happen first, we're ensuring ITW can actually still catch a bid along that line.
Best of all, the relative strength line in ITW is everything Kraft's isn't. If you decide to be a buyer here, the 50-day moving average is a solid place for your stop.
To see this week's trades in action, check out this week's Must-See Charts portfolio on Stockpickr.
-- Written by Jonas Elmerraji in Baltimore.
RELATED LINKS: >>4 Tech Stocks Under $10 to Watch >>5 Commodity Stocks to Trade for Gains >>The Truth About Amazon's DronesFollow Stockpickr on Twitter and become a fan on Facebook.
At the time of publication, author had no positions in stocks mentioned.
Jonas Elmerraji, CMT, is a senior market analyst at Agora Financial in Baltimore and a contributor to TheStreet. Before that, he managed a portfolio of stocks for an investment advisory returned 15% in 2008. He has been featured in Forbes , Investor's Business Daily, and on CNBC.com. Jonas holds a degree in financial economics from UMBC and the Chartered Market Technician designation.
Follow Jonas on Twitter @JonasElmerraji
No comments:
Post a Comment