Casual-dining chains have not been winners during this economic expansion. Millenials, with their need for more social media-worthy experiences, have been blamed for the decline in conjunction with Baby Boomers moving onto fixed incomes as they retire.
Dave & Buster's Entertainment Inc (NASDAQ: PLAY) provides an eat, drink, play, and watch experience for consumers. This hybrid entertainment/dining experience has fared well since going public in 2012, attracting higher-income adults in the 21-39 age range. Poor same-store sales last quarter knocked the premium off the stock price, but top and bottom-line growth were still strong. Margins and efficiency ratios top its competitors, and Wall Street and quant valuation models agree that there is a strong upside for this diamond in the casual-dining rough. You'll Probably Want to Sit Down for This
Casual dining, the traditional sit-down, full-service restaurant experience is getting hit by demographics. Millennials want hip, social-media worthy experiences and retiring Baby Boomers are thrifty on their fixed incomes. Headlines such as "Millennials Are Killing Chains Like Buffalo Wild Wings And Applebee's" are not uncommon.
Overall, the food service industry has seen increasing growth over the last eight months. The chart below indicates restaurant sales have grown around 3.8 percent YoY (blue line) after bottoming out at 1.6 percent in September 2017. Employee growth sits just below 2 percent, showing that operators have not regained much confidence with the sales uptick.

Source: BLS, U.S. Census, FRED
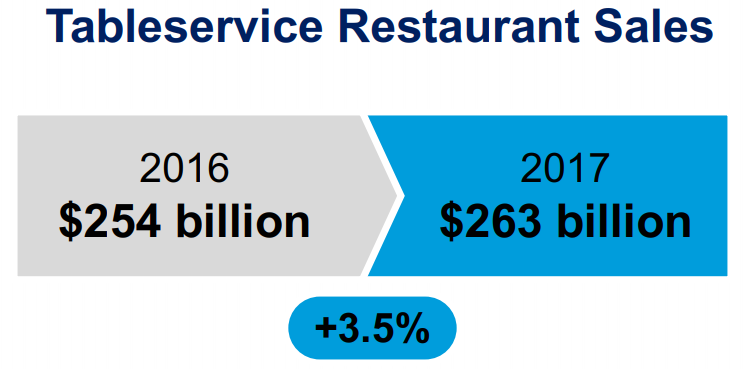
Growth within the industry is a bit lumpy, with limited-service restaurants, such as Wendys Co (NASDAQ: WEN) and Chipotle Mexican Grill, Inc (NYSE: CMG), growing at 5.3 percent in 2017 as compared to 3.5 percent for casual dining establishments according to the National Restaurant Industry.
Source: National Restaurant Association
Restaurants are doing everything they can to make the experience better for diners. Chili's, a subsidiary of Brinker International, Inc (NYSE: EAT), reduced their menu by 50 items. Applebee's, owned by Dine Brands Global Inc (NYSE: DIN) invested in tablets for every table to give the appearance of more on-demand service. "Endless Apps" at TGIF is an example of older chains playing the value card.

Picture Credit: TGI Fridays
Meanwhile, Dave & Buster's Entertainment, Inc. (NASDAQ: PLAY) has focused on the experience side of an evening out. Over the last decade, it has flipped the share of revenue from food and games, with entertainment now responsible for 56 percent of sales and driving a more than 2x increase in EBITDA margins.
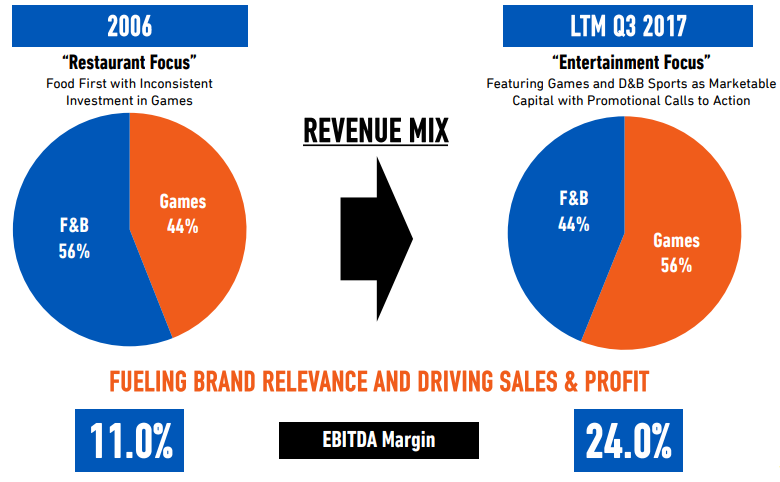 Source: Dave & Buster's Jan. 2018 Investor Presentation
Dave & Buster's Owns It Niche
Dave & Buster's is best known for its "Eat Drink Play Watch" tagline. Its restaurants provide full-service dining, a wide variety of alcohol, the latest video games, and plenty of televisions to follow sporting events. The chain owns all of its domestic stores, 106 as of February 2018, and has increased the count by 11.2 percent annually since 2012.

Source: Dave & Buster's Jan. 2018 Investor Presentation
D&B features the highest sales per store in the casual-dining industry, even compared to higher-end restaurants.

Source: Dave & Buster's Jan. 2018 Investor Presentation
Its demographics are a bit surprising. It is less a Chuck E. Cheese and more an adult experience. D&B's target audience is 21 to 39 years-old, and it has a 58 percent to 42 percent adults to family visitor mix.

Source: Dave & Buster's Jan. 2018 Investor Presentation
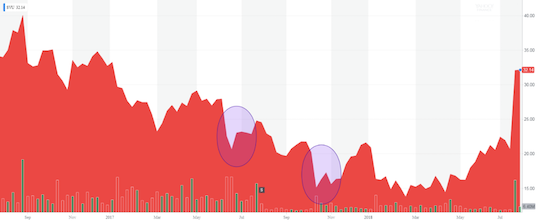
Since Dave and Buster's went public in October 2012, it has consistently grown revenues.

Source: finbox.io
Along with this revenue growth, the company has grown its margins. Net Profit Margin sits at 10.2 percent, impressive for the food industry.
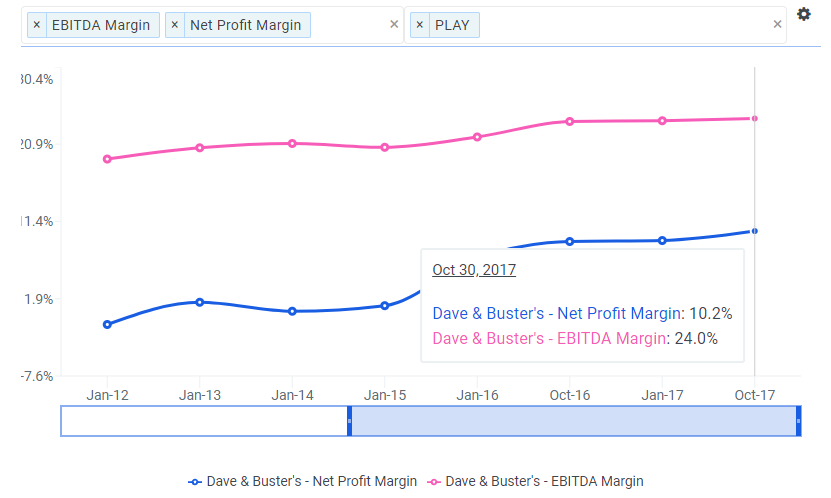
Source: finbox.io
In addition to Net Profit Margin, D&B leads its peers in managerial efficiency ratios including Return on Invested Capital, ROE, and Return on Assets.

Source: finbox.io
A well-executing management team also shows through in the restaurant chain's growth comps. It far outpaces its peers, and the Consumer Discretionary sector as a whole, with sales growth, net profit growth, and projected sales and net income growth.

Source: finbox.io
However, when it comes to a firm that is constantly opening new locations, same-store comps are an important measure. D&B features the two-year stacked metric in its latest Investor Presentation (chart below) versus Knapp-Track same-store sales estimates, which are based on a survey of 50+ casual-dining chains. With strong past performance, it is not surprising that the firm would focus on a two-year combination of same-store sales, but there are cracks starting to show. The stock has suffered after comps dropped in late 2017 and into 2018. For Q4, ended on February 4, same-store sales fell -5.9 percent, dragging the fiscal year down to -0.9 percent growth. Despite the weak comps, net income increased 34.9 percent on the quarter and 35.2 percent for the year. Management noted in the earnings call that while weather played a part, it had seen a fall-off on the entertainment side with its younger audience, and is focusing on improving the gaming experience while also offering more value opportunities with food and cocktail specials.

Source: Dave & Buster's Jan. 2018 Investor Presentation
Wall Street expectations remain strong for D&B. All ten analysts suggest accumulating the stock with four strong buys and six buy recommendations. Management has been doing a good job of managing expectations with four quarters of earnings surprises, but barely scraped by last quarter when everyone was caught off-guard with the weak same-store comps. Sales estimates are near double-digit for this and next year, but EPS estimates have fallen since the earnings release. Expectations are for negative EPS growth over the next quarters and years. D&B is dealing with the repercussions of strong past comps, but it is good to see that analysts have accepted a slower trajectory for the company.

Source: finance.yahoo.com
PLAY Should Trade at a Premium But Is Now Priced to Move
Dave & Buster's has the lowest trailing P/E among its peers (pink bars). Its Forward P/E is around average for the pack, but the expectations for declining earnings does leave it as the only one to see a higher future P/E. This can be seen as a positive, as it allows for easier earnings surprises compared to its peers.

Source: finbox.io
Price/Sales show the company as averagely valued relative to its peers. Sales can be a purer comparison among firms as they are typically less engineered than earnings.

Source: finbox.io
The firm's Enterprise Value multiples also do not show relative cheapness. While D&B's EV/EBITDA is lowest among its peers, the more honest Free Cash Flow metric is around average for the chains.
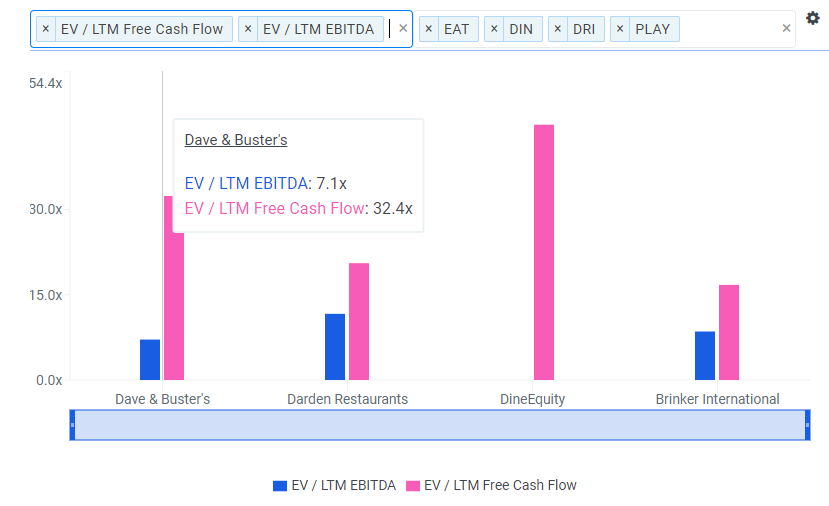
Source: finbox.io
Showing D&B's relative debt load is a bit difficult due to two of its competitors featuring negative equity. Compared to Darden Restaurants, Inc. (NYSE: DRI), and the Consumer Discretionary sector's 45 percent Debt/Equity ratio (pink bars), D&B's is a bit high. However, Debt/Total Capital provides more comps and shows the chain more favorably relative to its peers. The firm has focused on reducing debt bringing it down from $486 million in 2014 to $264 million last year.

Source: finbox.io
Dave & Buster's can easily afford its current leverage. Its 22.4x Interest Coverage ratio is highest among its peers. Its Cash Flow/Total Debt was an impressive 81.9 percent in 2017 according to finbox.io.

Source: finbox.io
While the stock appears fairly priced compared to its peers, it has clearly been a better performing company with higher per-store sales, better margins, and industry-best efficiency ratios. Wall Street believes in the management team with an average target price across nine analysts pointing to 41.8 percent upside. Finbox.io's quantitative valuation model also expects positive returns from the stock, but at a more conservative move of 28.2 percent.

Source: finbox.io
Dave & Buster's: Outplaying the Competition for a 28 percent+ Upside
With tepid wage growth, the feared impact of Millennials, and poor results from casual-dining chains in general expect the market to take a conservative view of the group. This sets Dave & Buster's up to easily beat Wall Street's expectations if it continues its strong performance.
Its margins and efficiency ratios show that management has been out-executing its peers. The fact that the stock shows up valued similarly to these competitors, rather than at a premium, points to an opportunity to invest in a star at an average valuation. Wall Street experts agree, forecasting nearly 42 percent upside for Dave & Buster's. Acting as a check against the sometimes qualitative view of analysts, Finbox.io's quantitative valuation composite also sees upside from the restaurant chain, calling for a gain of 28.2 percent. Dave & Buster's is positioned right to allow investors to eat up some stock gains.
Author: Matt Hogan
Expertise: Valuation, financial statement analysis
Matt Hogan is also a co-founder of finbox.io. His expertise is in investment decision making. Prior to finbox.io, Matt worked for an investment banking group providing fairness opinions in connection to stock acquisitions. He spent much of his time building valuation models to help clients determine an asset's fair value. He believes that these same valuation models should be used by all investors before buying or selling a stock.
His work is frequently published at InvestorPlace, Benzinga, ValueWalk, AAII, Barron's, Seeking Alpha and investing.com.
Matt can be reached at matt@finbox.io.
As of this writing, I did not hold a position in any of the aforementioned securities and this is not a buy or sell recommendation on any security mentioned.

Photo Credit: DaveandBusters.com


 Post to FacebookPosted!
 Winter wheat is harvested in a field farmed by Dalton and Carson North near McCracken, Kan. Kansas farmers are harvesting a smaller winter wheat crop amid an ongoing drought. CHARLIE RIEDEL, APFullscreen
 Winter wheat stands ready to by harvested in a field near McCracken, Kan. The government forecast U.S. winter wheat production at nearly 1.2 billion bushels, down 6 percent from last year. CHARLIE RIEDEL, APFullscreen
 Winter wheat is harvested in a field near McCracken, Kan. Kansas is the nation's leading wheat producer with a forecast of 270 million bushels, down 19 percent compared to a year ago. Kansas is expected to harvest 7.3 million acres of wheat. CHARLIE RIEDEL, APFullscreen
 Winter wheat is harvested in a field near McCracken, Kan. CHARLIE RIEDEL, APFullscreen
 Winter wheat is harvested in a field near McCracken, Kan. CHARLIE RIEDEL, APFullscreen
 Winter wheat is harvested in a field near McCracken, Kan. CHARLIE RIEDEL, APFullscreen
 Winter wheat stands ready to by harvested in a field near McCracken, Kan. CHARLIE RIEDEL, APFullscreen
 Winter wheat stands ready to by harvested in a field near McCracken, Kan. CHARLIE RIEDEL, APFullscreen
 Winter wheat stands ready to by harvested in a field near McCracken, Kan. CHARLIE RIEDEL, APFullscreen
 Winter wheat stands ready to by harvested in a field near McCracken, Kan. CHARLIE RIEDEL, APFullscreen
 Winter wheat is harvested in a field near McCracken, Kan. CHARLIE RIEDEL, APFullscreenInterested in this topic? You may also want to view these photo galleries:Replay
 1 of 11
 2 of 11
 3 of 11
 4 of 11
 5 of 11
 6 of 11
 7 of 11
 8 of 11
 9 of 11
 10 of 11
 11 of 11AutoplayShow ThumbnailsShow CaptionsLast SlideNext Slide

 Eternity (CURRENCY:ENT) traded 14.6% lower against the U.S. dollar during the 1 day period ending at 7:00 AM ET on May 28th. Over the last seven days, Eternity has traded 31.6% lower against the U.S. dollar. Eternity has a market capitalization of $156,350.00 and $1,349.00 worth of Eternity was traded on exchanges in the last day. One Eternity coin can currently be bought for approximately $0.0366 or 0.00000506 BTC on exchanges including YoBit, Trade Satoshi and Livecoin.