I tried to create a dividend stock portfolio that can outperform the market by a big margin. The following screen shows such promise. I have searched for profitable companies that are included in the Russell 1000 index with dividend yield and dividend growth rate that are greater than their industries' dividend yield and dividend growth. Those companies would have to show also a strong earnings growth prospects, and their last five years earnings growth is greater than their industries' earnings growth.
Russell 1000 Index
Description from Russell Investments:
The Russell 1000 Index measures the performance of the large-cap segment of the U.S. equity universe. It is a subset of the Russell 3000® Index and includes approximately 1000 of the largest securities based on a combination of their market cap and current index membership. The Russell 1000 represents approximately 92% of the U.S. market.
The screen's method requires all stocks to comply with all following demands:
Dividend yield is greater than the dividend yield of the industry.The payout ratio is less than 100%.The annual rate of dividend growth over the past five years is greater than the dividend growth of the industry.Average annual earnings growth estimates for the next 5 years is greater than 10%.Average annual earnings growth for the past 5 years is greater than the average annual earnings growth of the industry.The 8 stocks with the highest yield among all the stocks that complied with the first five demands.I used the Portfolio123's powerful screener to perform the search and to run back-tests. Nonetheless, the screening method should only serve as a basis for further research. All the data for this article were taken from Portfolio123.
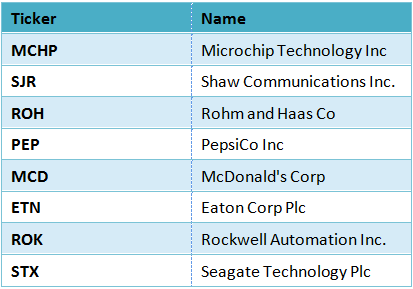
After running this screen on May 21, 2013, before the market open, I discovered the following eight stocks: Sunoco Logistics Partners LP (SXL), Leggett & Platt Inc (LEG), Copa Holdings SA (CPA), RPC Inc. (RES), Tupperware Brands Corp (TUP), Herbalife Lt! d (HLF), John Wiley & Sons Inc. (JW.A) and C.H. Robinson Worldwide Inc. (CHRW).
The table below presents the eight companies, their last price, their market cap and their industry.
(click to enlarge)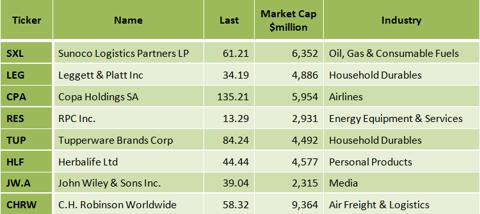
The table below presents the dividend yield, the payout ratio, the annual rate of dividend growth over the past five years, the trailing P/E, the forward P/E and the PEG ratio for the eight companies.
(click to enlarge)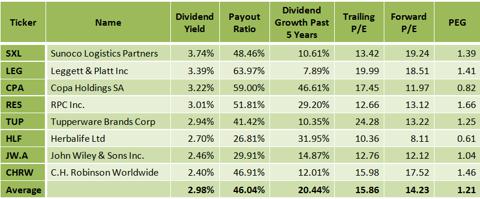
Back-testing
In order to find out how such a screening formula would have performed during the last year, last 5 years and last 14 years, I ran the back-tests, which are available by the Portfolio123's screener.
The back-test takes into account running the screen every four weeks and replacing the stocks that no longer comply with the screening requirement with other stocks that comply with the requirement. The theoretical return is calculated in comparison to the benchmark (S&P 500), considering 0.25% slippage for each trade and 1.5% annual carry cost (broker cost). The back-tests results are shown in the charts and the tables below.
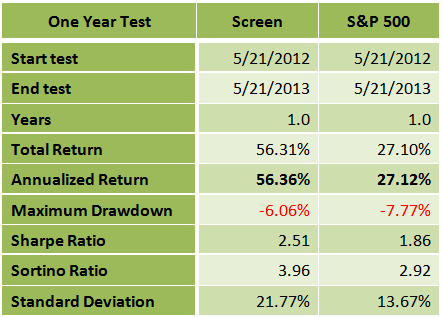
One year back-test
(click to enlarge)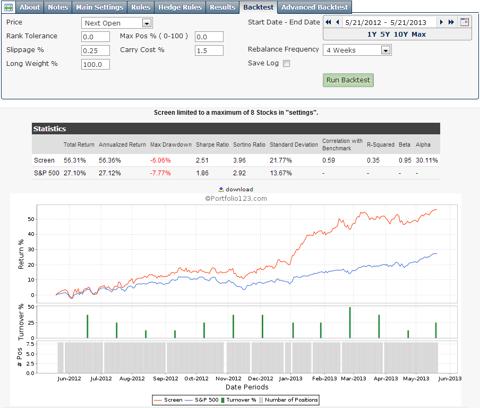
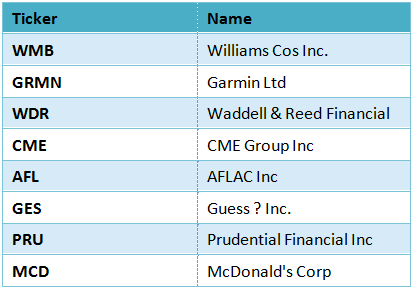
Just a matter of curiosity, the table below presents the eight companies originated by the screen formula one year before, on May 19, 2012.
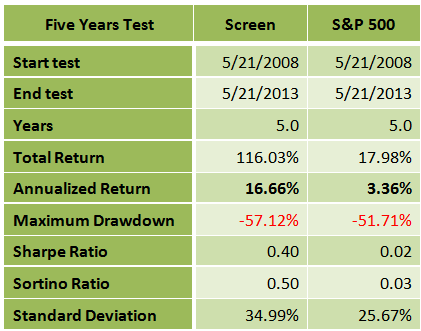
Five years back-test
(click to enlarge)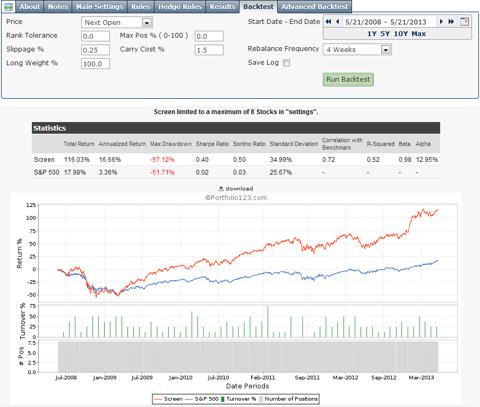
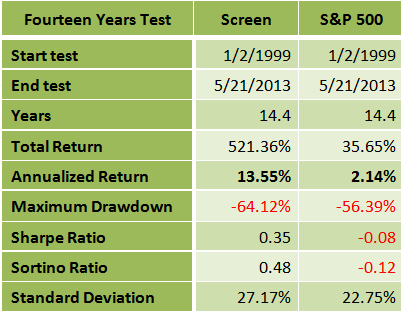
Fourteen years back-test
(click to enlarge)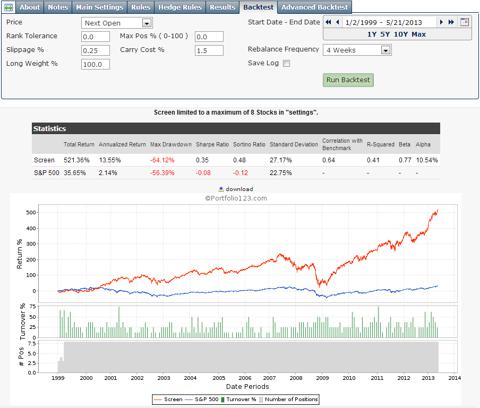
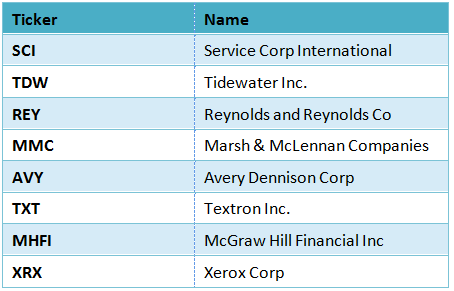
The table below presents the eight companies originated by the screen formula fourteen years before, on March 27, 1999.
Summary
The Russell 1000 good-yielding screen has given much better returns during the last year, the last five years and the last 14 years than the S&P 500 benchmark. The Sharpe ratio, which measures the ratio of reward to risk, was also much better in all the three tests. The one year return of the screen was exceptionally high at 56.36% while the return of the S&P 500 index during the same period was at 27.120%. The difference between the Russell 1000 good-yielding screen to the S&P 500 benchmark was much more noticeable in the 14 years back-test. The 14-year average annual return of the screen was at 13.55% while the average annual return of the S&P 500 index during the same period was only 2.14%. Although this screening system has given superior results, I recommend readers use this list of stocks as a basis for further research.
Disclosure: I have no positions in any stocks mentioned, and no plans to initiate any positions within the next 72 hours. I wrote this article myself, and it expresses my own opinions. I am not receiving compensation for it (other than from Seeking Alpha). I have no business relationship with any company whose stock is mentioned in this article. (More...)
No comments:
Post a Comment